

 How many times have you been force to wait for a simple task to complete because something in the background ends up thrashing your hard drive, slowing everything down? Helpless, you watch the light on the hard drive go from a flicker to a continuous glow, leaving you to wonder what process or program is the culprit.
To get to the bottom of annoying disk thrashing, an often over-looked feature of Task Manager, in both XP and Vista, provides the capability to add disk counters that can identify excessive disk activity.
By default, Task Manager displays the familiar CPU, Memory, Description, etc columns for each process that is running on your System. These columns are actually performance counters that are also found with Windows perfmon (performance monitoring) tool.
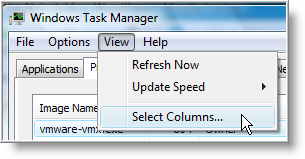
To add, additional counters, specifically for monitoring disk activity, open Task Manager by pressing Ctrl+Shift+Esc or right click on the Taskbar and select Task Manager.
Then, from Task Manager menu, select View \ Select Columns…
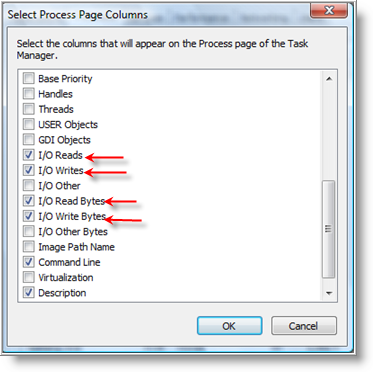
…scroll down and check I/O Reads, I/O Writes, I/O Read Bytes, I/O Write Bytes. Click OK when finished.
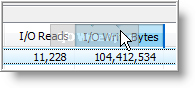
The four columns will be added to Task Manager. If the columns are not visible (because you need to scroll to the right), you can easily click and hold on a column, then drag it to the left and order the columns to your preference.
As you can see from my Task Manager, vmware-vmx.exe has been the most active process in the I/O Read Bytes, I/O Write Bytes columns.
NOTE: To easily identify the most active process, click on the column name to sort the data either highest to lowest or lowest to highest.
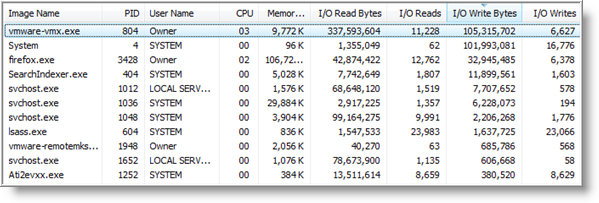
What's interesting, is that most of the disk thrashing that occurs is not from writing to disk, but caused by reading.
To help understand, what these counters mean, let's take a look at their definitions listed below.
- I/O Read Bytes - The number of bytes (bytes/sec) read in input/output operations generated by a process, including file, network, and device I/Os. I/O Read Bytes directed to CONSOLE (console input object) handles are not counted.
- I/O Reads - The number of read input/output operations (operations/sec) generated by a process, including file, network, and device I/Os. I/O Reads directed to CONSOLE (console input object) handles are not counted.
- I/O Write Bytes - The number of bytes (bytes/sec) written in input/output operations generated by a process, including file, network, and device I/Os. I/O Write Bytes directed to CONSOLE (console input object) handles are not counted.
- I/O Writes - The number of write input/output operations (operations/sec) generated by a process, including file, network, and device I/Os. I/O Writes directed to CONSOLE (console input object) handles are not counted.
Now that you know how to identify what is causing disk thrashing on your Computer, you can begin to troubleshoot. Start by disbaling programs or process, Do not just uninstall applications.
Make sure you pin point the problem and understand why it is occurring. Once you do, your disk thrashing days can finally come to an end.
Comments on Use Task Manager To Identify Excessive Disk Thrashing In Windows
ELMER @ 7:23 am
HEHE
Geoff Jenkins @ 9:01 pm
Surely these reads & writes are NOT (operations/sec) as per your article BUT total counts since startup!
@Geoff Jenkins
That's correct, reads & writes are measured in operations/sec and the number Task Manager displays is from last boot-up to present.
Rob @ 3:18 am
Hi - very useful article, thanks. I didn't realise (hadn't looked) that taskman could show those perfmon stats. Just worked out what was caning my disk this morning (Symantec AV downloading half a gif of new AV defs by the looks of it!)
I agree with Geoff that you can't really can interchange Bytes/s and Total Bytes. It's either one or the other, the article needs a small edit there as it is confusing. 🙂
Peter @ 3:03 pm
Yes, I also agree. Remove the reference to seconds where talking about the I/O counters — they have nothing to do with seconds!
Another important thing to note (although this is mentioned in the article) is that I/O numbers include network traffic. This means for example that webbrowsers will score high numbers, even though they may not be the applications that are causing all the disk activity.
I checked my PC's with both XP and Vista. Neither one have the option to view additional columns under task manager!
Forget it. Yes I do. I needed to switch to the Processes tab. Dah.
deckard cain @ 5:15 am
I think you can also try AnVir Task Manager!
try google on it
Jon Doe @ 7:00 pm
@deckard cain: Indeed very useful SW - thks for the tip!
Nancee Irish @ 12:48 am
My coder is trying to convince me to move to .net from PHP. I have always disliked the idea because of the expenses. But he's tryiong none the less. I've been using WordPress on several websites for about a year and am nervous about switching to another platform. I have heard fantastic things about blogengine.net. Is there a way I can import all my wordpress posts into it? Any help would be greatly appreciated!|