

![]() Tracking web site statistics is an important tool for Webmasters with understanding their web site performance. Knowing how your visitors arrived to your site and which popular keywords they click can help with conversion and sales. Using tools such as Google Analytics can help provide this information.
Tracking web site statistics is an important tool for Webmasters with understanding their web site performance. Knowing how your visitors arrived to your site and which popular keywords they click can help with conversion and sales. Using tools such as Google Analytics can help provide this information.
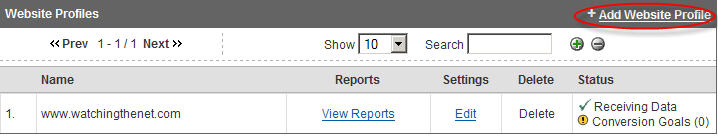
If you never used Google Analytics, you can sign up for free with any email account. After logging on , add your website by clicking the Add Website Profile (circled in below screen shot) follow the instructions for adding the code to your site pages. After 24 hours data will appear for your site. If you are unsure how to add code to your site, visit Google Analytics Help for instructions.
Tracking Popular Keywords
After data has been collected from your site, you can view which keywords are popular for your site. Select View Reports link next to your Domain name (see above screen shot). In the Reports dashboard, a statistical overview of your site is displayed.
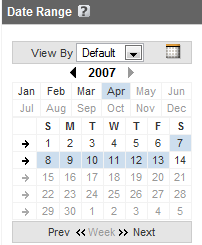
- First select the Date Range you want to view by selecting day, month or year from the calendar (left nav bar at bottom).
- In the All Reports section (above calendar), navigate to Marketing Optimization \ Marketing Campaign Results and click on Source Conversion. In the right window pane, you will see the top ten Sources for your Site. To view which keywords are popular, select a Source by clicking on the up arrow  then navigate to, Cross Segment Performance \ Keyword.
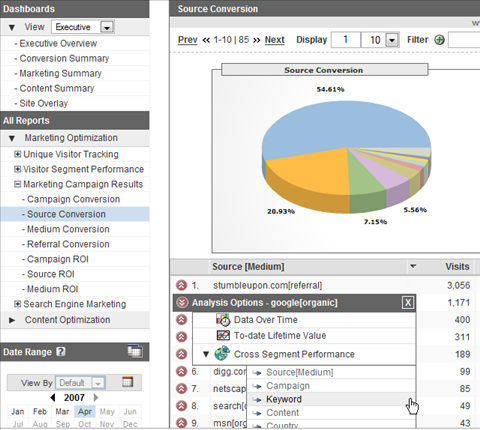
In the example above I have selected google[organic] as the Source to view which keywords or phrases visitors are selecting to find my site.
TIPS:
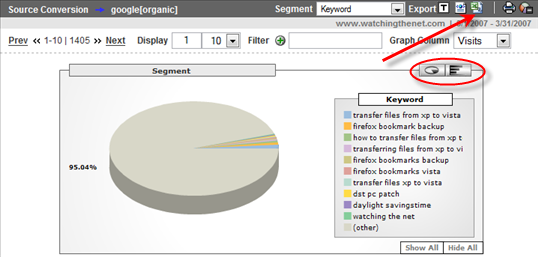
- Clicking on the pie chart will display the percentage per slice for each keyword.
- To scroll through all keywords found, use the Prev << and >> Next links.
- You change the view from pie chart to bar graph by using the toggle circled in above screen shot.
- The data can be exported as Tab Separated (Text), XML, or CSV (Excel) as shown by the red arrow in above screenshot
If Google Analytics has been collecting data over time, you can compare months of data at once by using the calendar and selecting any date ranges, or a comparison of two dates or ranges. Click on the question mark next to Date Range for specific instructions for displaying date ranges.
Google Analytics is a powerful tool compared to Awstats reporting in your Cpanel web host account. Having the ability to have data presented graphically is easier to understand how your web site is performing and what pages are popular with your visitors. All of which will add up to more conversions and sales!
For more information, see Which Articles Are Popular On Your Website Using Google Analytics.
Leave a Comment