

 It seems to never fail, every time a process causes high CPU utilization, it always returns to normal just before you had the chance to identify the process in Windows Task Manager. On top of that, Task Manager only displays information in real time, which doesn't help if you need to see what just happen a few seconds or a minute ago.
Unless you got lucky and quickly open Task Manager to see which process caused the high CPU utilization, you probably just missed catching the culprit.
To get around this dilemma, the tool Process Explorer from Microsoft (formally Sysinternals) can display process information that occurred in the past, allowing you to catch the process that's bogging down Windows intermittently.
By default Process Explorer displays updated activity every two seconds (which can be modified). Viewing the CPU graph in System Information mode, you can easily mouse over the spikes which will display the process name, it's PID (Process Identifier), the CPU usage (percent) and the exact time of the spike.
To be able to capture past history, Process Explorer needs to be running, which isn't a problem since it can be minimized in the System Tray.
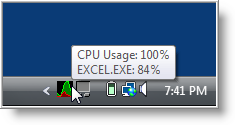
The next time a process causes a spike, just mouse over the icon in the System Tray and the pop-up will display the process name and percentage of utilization. You can even move the mouse around to view other spikes and identify the process.
While that's cool, it's a small window and sometimes when Windows really bogs down and becomes unresponsive, you may not be able to use the icon in the System Tray. This is where Process Explorer really shines in it's capability to view recent past data history.
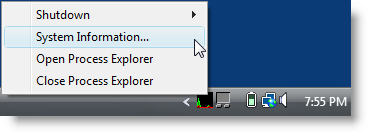
When CPU utilization returns to normal, and you are actually able to perform a task, right click on the icon (in System Tray) and select System Information.
When System Information opens, press the space bar to pause Process Explorer from updating, and mouse over the spike (or spikes) to identify the process. The graph will display the last twelve minutes of activity.
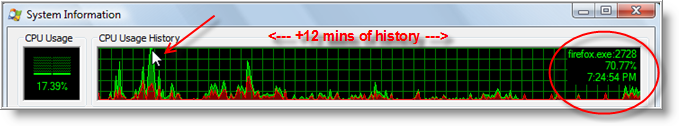
From here you can open Process Explorer by clicking on it's icon in the System tray, to identify information about the process and it's path location.
In case you're wondering, the red spikes in the graph represent kernel times, while the green spikes are application related.
Another nice feature of Process Explorer is the capability to sort process utilization by clicking on the CPU History column.
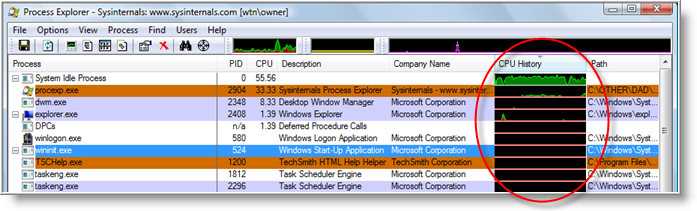
TIP: If you don't see the CPU History column, you can add it by clicking on View \ Select Columns… then select the Process Image tab and check the box next to CPU History and click OK.
I'm not sure of the time length that is displayed, but it's a good way to visualize CPU utilization for all processes and pick out the culprits that's slowing down your system.
Now that you know how to catch processes that causes high CPU usage, you will want to make sure that Process Explorer is configured properly for it's update speed.
To do this, click on View \ Update Speed and set it to either one or two second interval. Setting it to anything higher may prevent a process from being captured during quick spikes.
Process Explorer is a stand alone application, requires no installation. and can be downloaded from Microsoft's Sysinternals Technet site.
Process Explorer works on Windows 9x/Me, Windows NT 4.0, Windows 2000, Windows XP, Server 2003, and 64-bit versions of Windows for x64 and IA64 processors, and Windows Vista and Windows 7.
Comments on How To Identify Processes That Cause High CPU Utilization Spikes In Windows
I am using version 14.1 of Process Explorer, when I go into the CPU Usage History and "press the space bar to pause Process Explorer from updating" it just switches from showing me all 4 core cpu's individually to them combined. It doesn't pause the graph so I can mouse over the spikes easily without the graph moving on me. Is there a different way to pause the CPU Usage History?
^^^Just figured it out. I was able to do this from View - Update Speed - Pause. Or, I had to have the "Process Explorer" window active when I hit space bar to pause it, not be active on the "System Information" window.
This is good except when there is 100% CPU consumption and freeze up the system, you won't be able open it to check which process is causing that. And after a force reboot, it will be emptied.
Is there a way to capture into a log file so that at least after a force reboot, I can check which process is incurring high CPU consumption?
@bhwong: @bhwong were you able to figure out how to capture the log. I am experiencing the same issue. Would like to check history of what is causing the high CPU usage. Once it reaches 95%+ i am not able to access the system to view