

 Windows Vista diagnostic tools, features many new additions over past Windows releases, specifically for the consumer editions. One tool that offers an all in one view of critical System components is the Reliability and Performance Resource View. The Resource View provides built in monitors for CPU, Disk, Network, and Memory components. In this guide we'll look at Disk usage and how you can identify disk activity and possible bottlenecks.
In order to access Resource View, you must be a member of the local Administrator group or launch the tool using 'Run As". To start Resource View:
Click Start, right-click on Computer, and click Manage then expand System Tools and click Reliability and Performance. Reliability and Performance Monitor will start with the Resource View display.
Or you can click on Start \ Run and type perfmon /res in the run box.
Once opened, click on Disk to expand the view for all Disk activity.
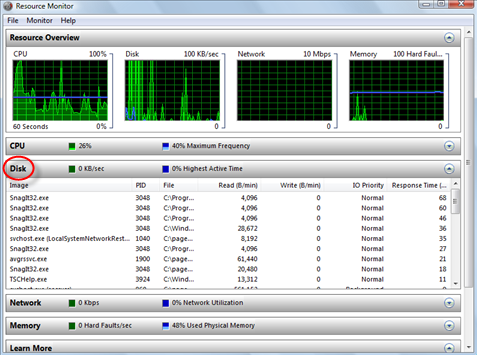
The Disk graph displays the total current I/O activity in green, and the highest active time percentage in blue. Seven columns are displayed, and the definitions of each column follows:
- Image - the application using Disk resources
- PID - process ID of the application instance
- File - the file being read and/or written by the application instance
- Read - current speed (in Bytes/min.) at which data is being read from the file by the application instance
- Write - current speed (in Bytes/min.) at which data is being written to the file by the application
- IO Priority - priority of the IO task for the application
- Response Time - response time in milliseconds for the disk activity
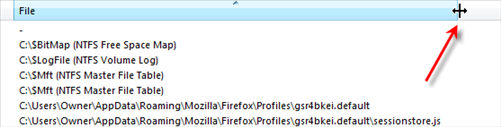
The first thing I like to do, is sort the Response Time column from highest to lowest time, then expand the File column so I can see the actual files that are causing disk activity to occur. To expand, use your mouse to grab the column and drag it to the right.
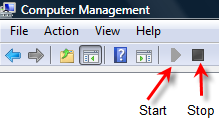
When troubleshooting problems, you can stop the monitor from updating in real time, by clicking on Monitor from the menu and selecting Stop (if you used perfmon /res to launch Resource View), or by clicking on the the Stop button on the Computer Management Toolbar (if you right-click on Computer, and clicked Manage).
By stopping the monitor you can then identify which application or file is causing the most disk activity to occur either by reading or writing from the disk. You can also match it to the Image name to further identify the Process and PID number and see if CPU activity is also being effected. Two columns to keep an eye on are Write and Response Time, These columns are good indicators for identifying high disk activity.
Once you identified the cause, and if it is a misbehaving application, check to see if it is associated to any Services and stop them. Uninstall the application if necessary, or stop the program from auto starting during startup. If it is a Vista process, check Microsoft's site for any patches or bugs.
While it may seem like an application or System process is causing the problem, other problems that cause disk bottlenecks can be a result of a disk that is highly fragmented, low on disk space, or just needs some cleanup using Disk Cleanup. Also your disk drive could be old and may be on the verge of dying.
Other tools such as Performance Monitor can be used for more troublesome problems, but Windows Vista Reliability and Performance Resource View is a good start that can assist in quickly identify bottlenecks or high disk activity.
Comments on How To Identify Disk Activity And Bottlenecks In Windows Vista
Is the disk response time metric only available in real-time? I would really like to be able to record this value for given applications over a prolonged period. I don't see it as an available counter under the Process object in Performance Monitor.
Try using the Physical Disk - Disk Transfers/sec which is the rate of read and write operations on the disk. Or you may be able to measure by using the counter - Avg. Disk sec/Transfer.
What does "% Highest Active Time" refer to? I see this at 0% even during decent disk io and I see it at 100% even during no disk io. Does anyone know exactly what it is?
Excellent help.Thank you.Roxio was my problem(after restoring Vista) but not any more!