

![]() Tracking web site statistics is an important tool for Webmasters with understanding their web site performance. Knowing which pages receive the most traffic can help with conversion and sales. An example, is tracking which articles are most viewed by visitors on your site. One tool that can help provide this information is Google Analytics.
Tracking web site statistics is an important tool for Webmasters with understanding their web site performance. Knowing which pages receive the most traffic can help with conversion and sales. An example, is tracking which articles are most viewed by visitors on your site. One tool that can help provide this information is Google Analytics.
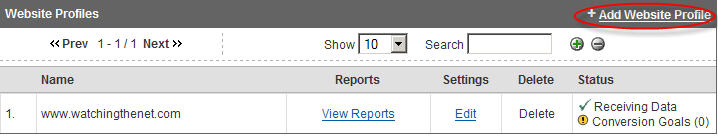
If you never used Google Analytics, you can sign up for free with any email account. Once you have logged on, add your website as shown below and follow the instructions for adding the code to your site pages. (NOTE-it will take up to 24 hours for data to appear in your account). If you are unsure how to add code to your site, visit Google Analytics Help for instructions.
Tracking Popular Articles
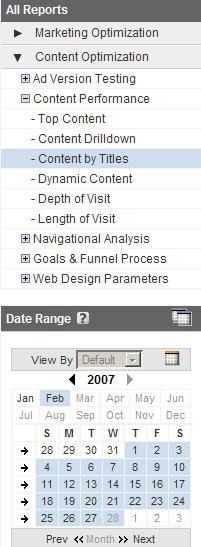
When data has been collected from your site, you can view which articles are popular on your site by clicking on View Reports, and selecting the date range from the Calendar in the lower left hand corner. Then navigate to All Reports - Content Optimization - Content Performance - Content By Titles:
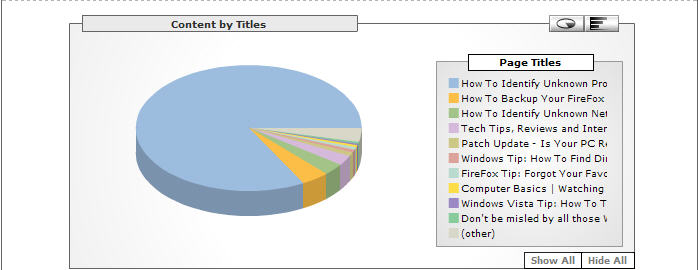
This view lists 10 of your most popular articles on your site. The statistics Unique Views displays the number of visits during which this page (determined by the combination of URI and title) was viewed. Pageviews is the number of times the page was viewed.
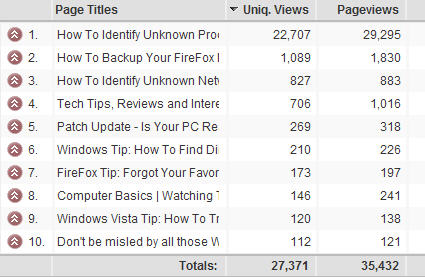
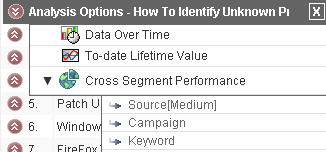
To fully understand how visitors are reaching the articles, you can dig deeper and see which keywords are bringing the visitors to your site. Simply click on the up arrow  next to an article and navigate to, Cross Segment Reporting - Keyword.
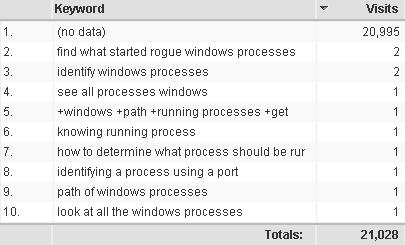
Looking at the number of Visits, you can see the most visits are with (no data). This is because no data represents visitors who found the page from a referral link. The remaining statistics represent pages that were found from organic searches (looks like I need to work on my organic search results!).
If Google Analytics has been collecting data over time, you can compare months of data at once by using the calendar and selecting any date ranges, or a comparison of two dates or ranges. Click on the question mark next to Date Range for specific instructions for displaying date ranges.
Google Analytics is a powerful tool compared to Awstats reporting in your Cpanel web host account. Having the ability to have data presented graphically is easier to understand how your web site is performing and what pages are popular with your visitors. All of which will add up to more conversions and sales!

Leave a Comment